
NASA Space Apps 2026 · Dancing with the SARs · Miami
Hear the Earth move.
NASA-ISRO's NISAR radar measures millimetres of ground motion through clouds, at night and under forest. SARPulse lets you see it, scrub through time, and hear it.
- Orbit
- 747 km
- Swath
- 242 km
- Repeat
- 12 days
- L-band
- 24 cm
- S-band
- 9.4 cm
Why radar
A camera needs daylight. Radar brings its own.
Synthetic aperture radar sends microwaves down and listens to the echo. It works at night, sees through clouds, and, at L-band, reaches the trunks and water under a forest canopy.
- Night and cloudOptical satellites go blind. Radar does not.
- Under the treesThe 23.8 cm L-band wave slips past leaves to the water below.
- MillimetresComparing the phase of two passes reveals motion far smaller than a pixel.
The idea
Phase becomes motion.
Two passes over the same ground differ in phase by Δφ. That phase is a ruler: it turns directly into motion along the line of sight, and one full colour cycle is half a wavelength.
One colour cycle means 11.9 cm of motion at NISAR L-band. Shorter waves, more cycles.
Miami is sinking in places you can name.
2–8 cm
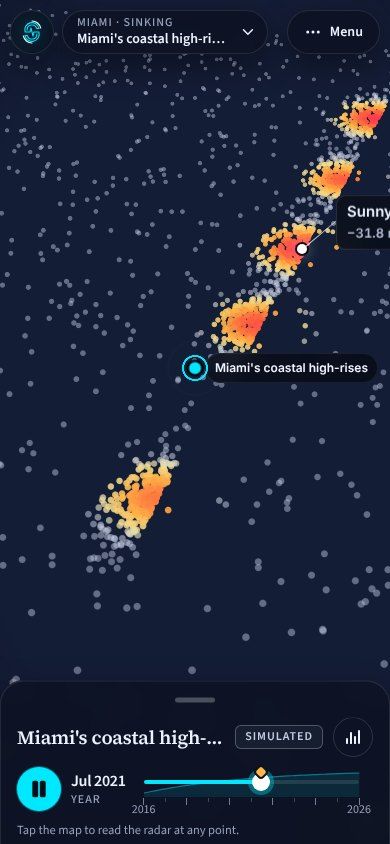
35 coastal high-rises between Sunny Isles Beach and Miami Beach sank this much between 2016 and 2023, mostly while they were being built (Aziz Zanjani et al., 2024). In SARPulse each radar reflection glows by how far it sank, and at street zoom the real buildings rise in 3D.
See Miami in the viewer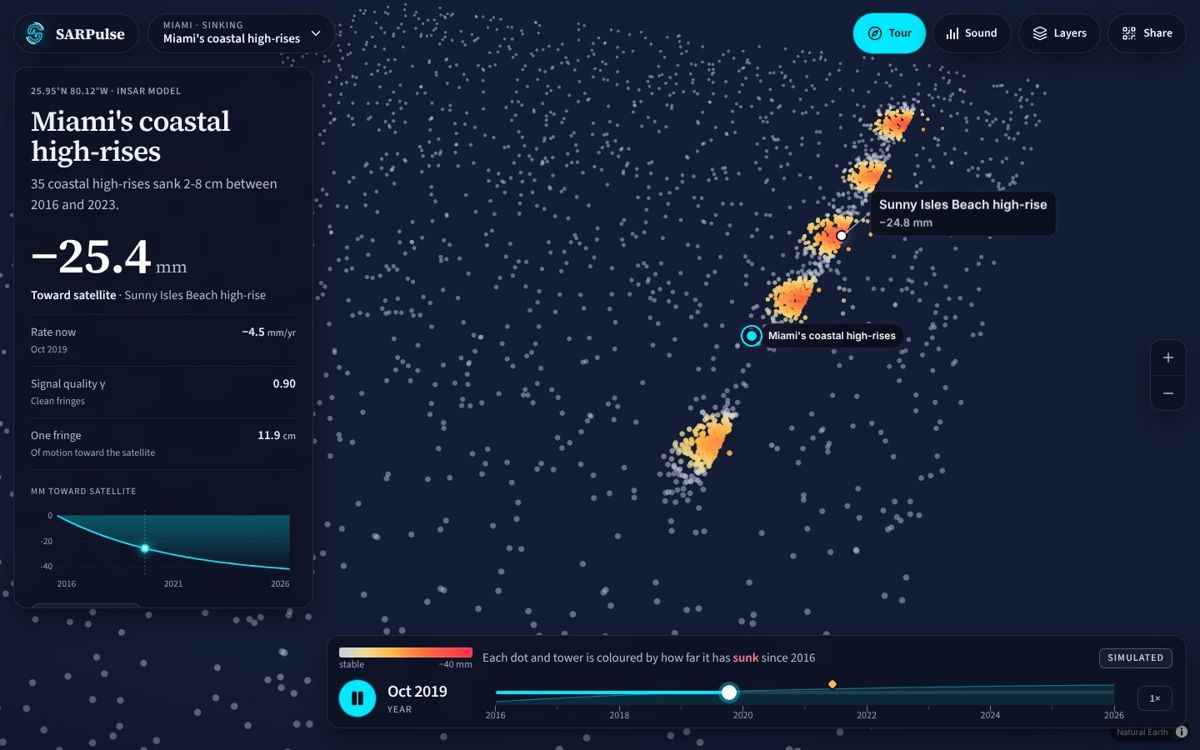
Water moves under the sawgrass.
14.9 cm
In wetlands the radar bounces off the water and then the stems, so a change in water level shortens the path. One L-band fringe is about 15 cm of water, the same number FIU measured, for a restoration plan worth roughly USD 23 billion.
Open the Everglades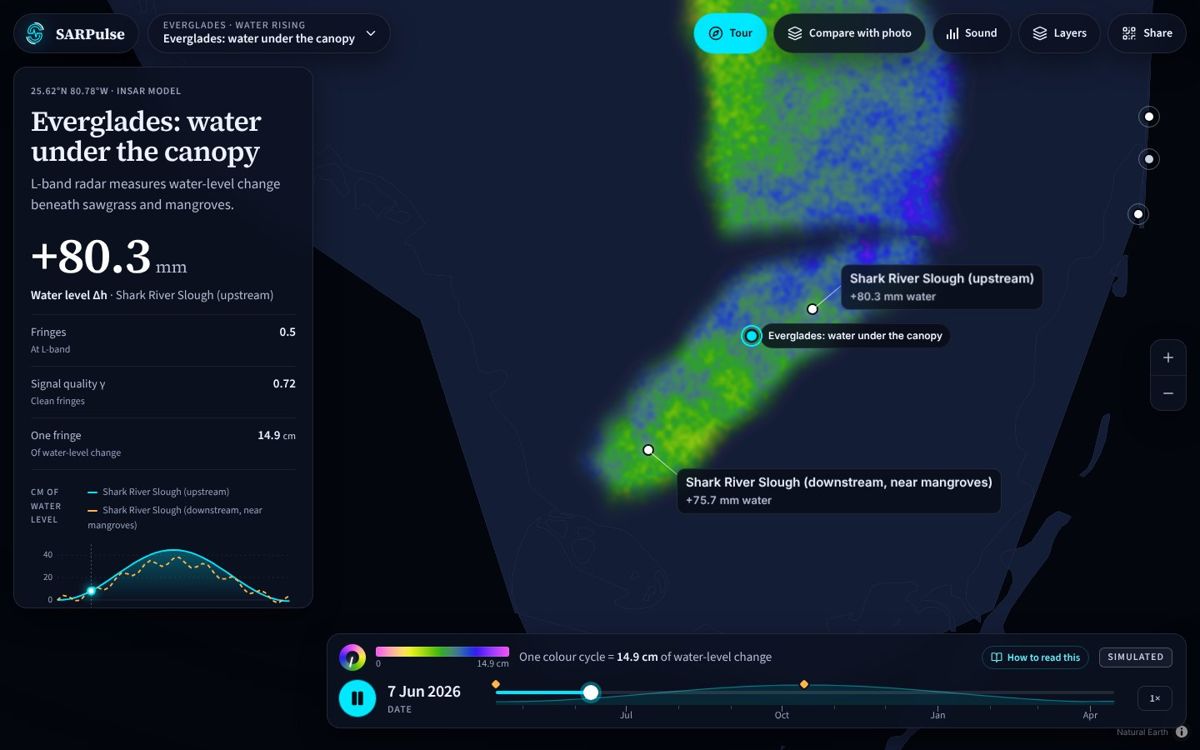
A volcano breathes in.
~2 cm / month
Magma refilling about 4 km beneath Svartsengi, Iceland, lifts the ground in rings. Switch the band and the rings tighten four times over: that is the trade-off between L, S and C waves in one gesture.
Watch it rise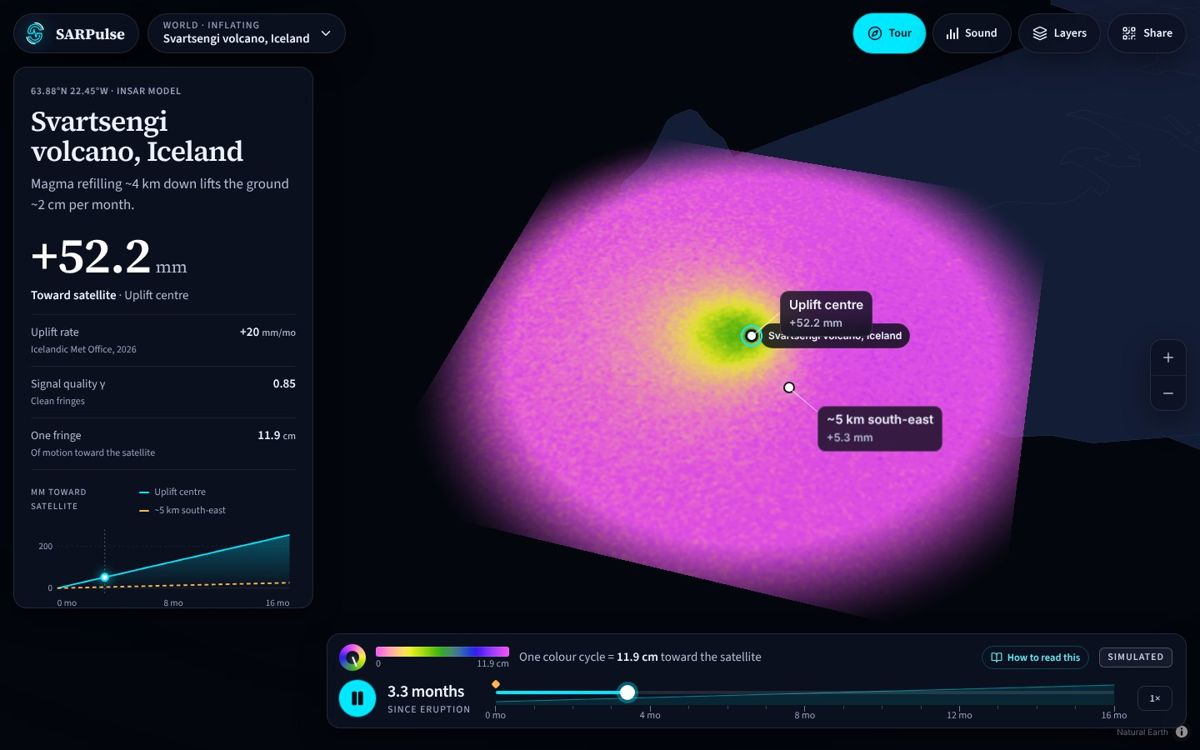
And the rest of the planet.
Tides flex the floating ice of Thwaites Glacier in Antarctica. In Rondônia, Brazil, live NISAR imagery streamed from NASA shows forest turning to pasture. The viewer starts on the globe and flies you to each one.
Hear it
Listen to the ground.
Motion away from the satellite lowers the pitch to 55 Hz, motion toward it raises it to 440 Hz, every fringe you cross clicks, and noisy phase adds hiss. Move across a volcano and you can hear where it lifts.
Rising climbs toward 440 Hz, sinking falls toward 55 Hz.
Or turn on Sound in the viewer. On a phone, tap the map to hear that spot.
Beyond the map
Detect, predict, act.
A map of where the ground already moved is only the start. The goal is to find the places that are moving now and get them to the people who can fix them.
- 1Detect
NISAR's L-band radar, 24 cm wavelength, sees ground motion through trees and asphalt, day or night. Repeat passes build a time series, so slow trends show up where a single image cannot.
- 2Predict
Rank every area by how fast it moves. A steady fall is a warning sign, which is why the tiers below use speed, not a single snapshot.
- 3Act
Hand the ranked list to the people who can do something about it, before a failure, not after.
Triage tiers Context
- Stablebelow 1 mm per year
Keep watching. Normal inspection schedule.
- Elevated1 to 2.5 mm per year
Add a site visit and ground-penetrating radar to check for voids.
- Criticalabove 2.5 mm per year
Engineering review now; consider pressure grouting before cracks open.
What people could do
- Miami high-risesCheck and strengthen foundations
Flag buildings that keep settling for inspection. If ground-penetrating radar finds voids in the limestone, engineers can pressure-grout them. After Surfside, recertification can start from radar instead of a clipboard.
- Biscayne AquiferAdjust pumping
If subsidence tracks groundwater pumping, well-field operators could ease withdrawals, which also helps hold back saltwater.
- EvergladesWatch for dry-out
Falling water under the canopy, seen by radar, is an early sign of dry peat. Water managers could use it when deciding how to run culverts and gates.
The tiers are a proposal for discussion, not an engineering standard. At Surfside, radar saw no settlement before the 2021 collapse, so SARPulse is a screening aid for inspectors, never a substitute for them.
Get the data
Where the radar lives.
NASA's Alaska Satellite Facility (ASF DAAC) archives and shares the world's radar data, free with an Earthdata login. Its Data Search is the front door to every dataset below.
17 datasets
- NISARValidated2025 to present · NASA/JPL
L-band and S-band radar for ecosystems, moving land and ice, imaged every 12 days on ascending and descending passes.
- Sentinel-12014 to present · ESA
Twin C-band radar satellites: day-and-night, all-weather imagery of the whole planet.
- S1 Bursts2014 to present · ESA
The individual radar bursts that make up each Sentinel-1 sub-swath, for finer-grained searches.
- OPERA-S12014 to present · OPERA-JPL
Sentinel-1 backscatter (RTC) almost everywhere, plus CSLC products over North America.
- TROPO2014 to present · OPERA-JPL
Atmospheric radar delay maps, used to clean ground-motion measurements.
- ALOS-22014 to present · JAXA/METI
L-band PALSAR-2 ScanSAR: wide-swath single look complex scenes revisited about every 14 days.
- ALOS PALSAR2006 to 2011 · JAXA/METI
Mapping, regional land cover, disaster monitoring and resource surveys.
- ALOS AVNIR-22006 to 2011 · JAXA
Visible and near-infrared images corrected for sensor distortion, ready to overlay on maps.
- SIR-CBeta1994 · NASA
Radar flown on two Space Shuttle Endeavour missions to study large-scale environmental processes.
- ARIA S1 GUNWNISAR-format2014 to present · ARIA-JPL
Ready-made Sentinel-1 interferograms (level 2) from JPL's ARIA project.
- SMAP2015 to present · NASA
Global soil moisture in roughly the top 5 cm of soil, and whether it is frozen or thawed.
- UAVSAR2008 to present · NASA
Airborne repeat-track radar built for interferometry.
- RADARSAT-11996 to 2008 · CSA
Canadian C-band SAR, night and day in all weather. Removed from searchable interfaces.
- ERS1991 to 2011 · ESA
SAR imagery over ASF and McMurdo station masks, suitable for interferometry. Removed from searchable interfaces.
- JERS-11992 to 1998 · JAXA
Japanese high-resolution all-weather imaging radar for surveys, farming and forestry. Removed from searchable interfaces.
- AIRSAR1990 to 2004 · NASA/JPL
Airborne radar whose longer wavelengths reach into forest canopy. Temporarily removed from searchable interfaces.
- SEASAT1978 · NASA
NASA's first SAR, flown to watch the oceans.
Filters for NISAR
- Search type
- Geographic search by area of interest (draw a shape or paste WKT, or search for a place)
- Dates
- Start and end date, plus a seasonal search
- Science product
- Production configuration and data maturity
- Scene name patterns
- Comma-separated names with * and ? wildcards
- Polarisation
- Main band (frequency A) and side band (frequency B), 8 options each
- Flight direction
- Ascending or descending
- Instrument
- L-band or S-band
- Frame coverage
- Full or partial frames
- Range bandwidth
- 7 choices
- Acquisition coverage
- 2 observation types, including joint L- and S-band passes
- Track and frame
- Start and end ranges for each
Reading a NISAR scene name
NISAR_L2_PR_GCOV_034_047_A_015_4005_DHDH_…
- NISAR
- The mission
- L2
- Processing level: L0 raw, L1 single look complex, L2 geocoded
- PR
- Production configuration
- GCOV
- Product: geocoded polarimetric covariance (others: RRSD raw, RSLC, GSLC)
- 034
- Repeat cycle, which steps up every 12 days
- 047
- Track (relative orbit)
- A
- Ascending (D is descending)
- 015
- Frame along the track
- 4005 · DHDH
- Mode and polarisation codes
In the search tool
- Scenes list with a map footprint, zoom-to-scene and a downloads queue
- On-demand processing through HyP3 for supported datasets
- SBAS stack builder: pick a scene and get every overlapping scene
- Validated NISAR L-band products are flagged, with a link to their documentation
Summarised from the public ASF Data Search page; datasets and filters change, so check the site for today's list.
Your first minute
How to use the viewer.
- 1Take the 90-second tour
The Tour button flies through five places with captions. Swipe or use the arrow keys.
- 2Pick a place
The place menu lists every site. Each shows a live thumbnail of its radar field.
- 3Play and scrub
Drag the timeline. Rings multiply as the ground moves. Orange markers flag real events.
- 4Change the radar
Layers switches band (L, S, C), basemap and NASA live layers. Compare with photo splits optical against radar.
- 5Turn Sound on
On a computer, hover across the map. On a phone, tap any spot to hear it.
Honest by design